Graphviz and Text-CSV perl modules are the prerequisites. Most latest linux distros come with perl preinstalled, if not then install perl as well.
# yum install perl
# wget http://search.cpan.org/CPAN/authors/id/E/ER/ERANGEL/Text-CSV-0.5.tar.gz
# tar zxvf Text-CSV-0.5.tar.gz
# cd Text-CSV-0.5
# perl Makefile.PL
# make
# make install
Install graphviz, download the latest version of afterglow and untar it
# yum install graphviz
# wget http://sourceforge.net/projects/afterglow/files/latest/download?source=files
# tar zxvf afterglow-1.6.2.tar.gz
Now since you have followed my previous post on setting up psad and argo you have psad installed (If not click here). Afterglow can read data from CSV files, so the log file has to be converted to CSV format using psad.
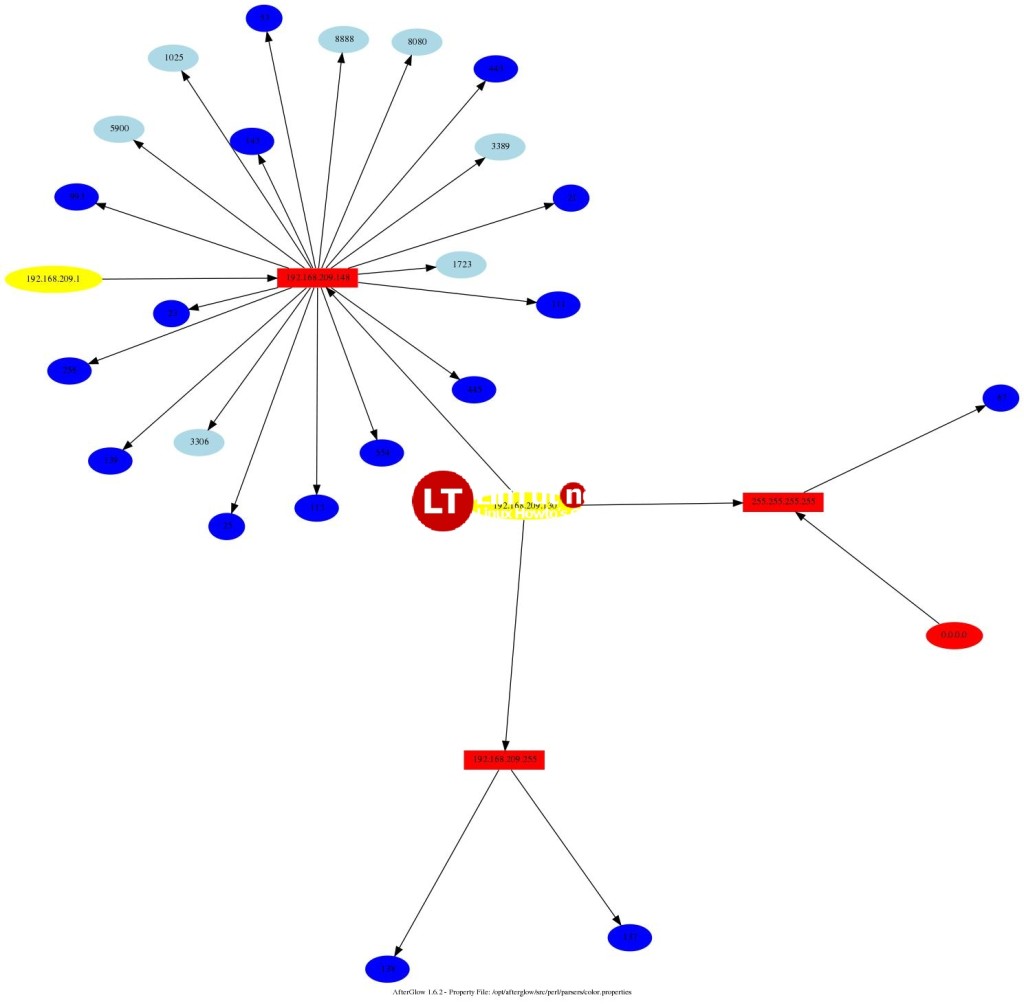
# psad --CSV --CSV-fields "src dst dp sp" --CSV-max 1000 -m /var/log/firewall.log | perl /opt/afterglow/src/perl/graph/afterglow.pl -c /opt/afterglow/src/perl/parsers/color.properties | neato -Tjpg -o iptable_graph03.jpg
The command is self explanatory, psad is is being used to create CSV file with the CSV flag, the columns are src ip and ports, dst ip and ports the max entries being 1000 -m followed by the log file piped to afterglow perl script with the color.properties file and everything finally piped to neato utility that comes with the graphviz package to convert it to jpg file.
The color.properties file can be edited to create an image with colors of your choice.
