Htop is very interactive, gives you additional information about running processes, and allows for manipulations such as sorting the list of processes using various criteria and search for a process/kill processes. While top command takes few seconds delay to collect data where htop is much faster.
In this tutorial, I will show you how to install and use htop on CentOS 8/RHEL 8 Linux.
Advantages of htop over top include
- Colored output resource usage statistics.
- The ability to end or kill processes without typing their PIDs.
- Htop allows mouse usage, unlike top which doesn’t support it.
- Better performance than top command.
Let’s now jump in and see how to install this handy feature.
Install htop on CentOS 8
The first step in the installation of the Htop tool is to enable the EPEL repository. To do so, run:
# dnf install https://dl.fedoraproject.org/pub/epel/epel-release-latest-8.noarch.rpm
After the installation of the EPEL repository, update the system.
# dnf update
To install htop tool, simply run the command:
# dnf install htop
[ads]
After the installation is complete, you can find more information about htop using the command:
# dnf info htop
Example output:
# dnf info htop
Last metadata expiration check: 0:11:08 ago on Mon 23 Dec 2019 02:03:24 PM EST.
Installed Packages
Name         : htop
Version      : 2.2.0
Release      : 6.el8
Arch         : x86_64
Size         : 263 k
Source       : htop-2.2.0-6.el8.src.rpm
Repo         : @System
From repo    : epel
Summary      : Interactive process viewer
URL          : http://hisham.hm/htop/
License      : GPLv2+
Description  : htop is an interactive text-mode process viewer for Linux, similar to
             : top(1).
Using htop
To launch htop, simply run the command:
# htop

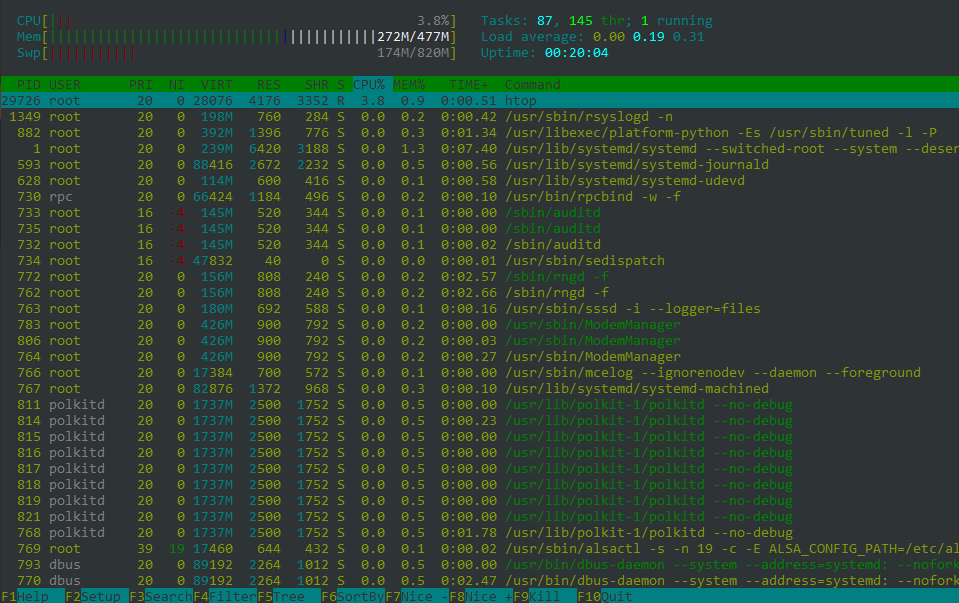
Here is what each column means:
PID: A process’s process ID number.
USER: The owner of the process.
PR: The process’s priority. The lower the number, the higher the priority.
NI: The nice value of the process, this affects its priority.
VIRT: The virtual memory the process is using.
RES: The physical RAM the process is using, usually measured in kilobytes.
SHR: The shared memory the process is using.
S: The current status of the process (sleeping, zombied, running, traced or uninterruptedly sleeping).
%CPU: The percentage of the processor time used by the process. It displays the % of CPU used at the end of the bar. The bar itself will shows low-priority in blue, normal in green, kernel in red.
%MEM: The percentage of physical RAM used by the process.
TIME+: The processor time the process has used.
COMMAND: The name of the command that initiated the process.
The footer displays the htop menu commands.
To get help with the command usage, simply run:
# htop --help
]# htop --help
htop 2.2.0 - (C) 2004-2019 Hisham Muhammad
Released under the GNU GPL.

-C --no-color               Use a monochrome color scheme
-d --delay=DELAY            Set the delay between updates, in tenths of seconds
-h --help                   Print this help screen
-s --sort-key=COLUMN        Sort by COLUMN (try --sort-key=help for a list)
-t --tree                   Show the tree view by default
-u --user=USERNAME          Show only processes of a given user
-p --pid=PID,[,PID,PID...]  Show only the given PIDs
-v --version                Print version info

Long options may be passed with a single dash.

Press F1 inside htop for online help.
See 'man htop' for more information.
Alternatively, you can view the man pages by running:
# man htop
Conclusion
This page showed you how to install and use htop on CentOS 8 Linux. If you have any questions or feedback, do share it with us in the comment section below.
See also: Best command line tools for linux performance monitoring