In this article, we will introduce a list of free and open source monitoring system that is helping you to monitor system resources such as CPU load, the RAM memory usage, network traffic statistics or memory consumption.
In this article I’ve listed top 8 web based Linux monitoring tools which can cover almost all aspects of sysadmin’s monitoring tasks.
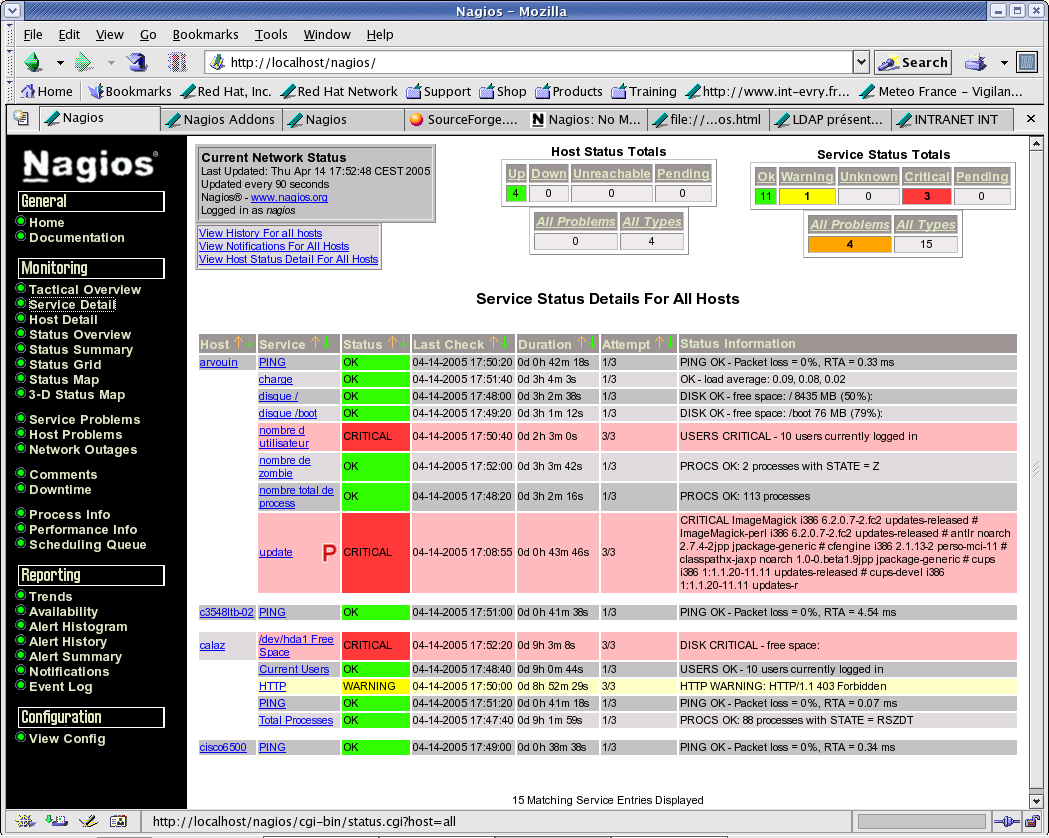
1. Nagios

This is one of the most popular web based Linux monitoring systems nowadays, actually it’s industry standard for IT infrastructure monitoring. Nagios is licensed under GNU General Public License which gives you permission to copy, broadcast and/or change it under certain conditions obviously.
Nagios features:
- Monitoring of network services (SMTP, POP3, HTTP, NNTP, PING, etc.)
- Monitoring of host resources (processor load, disk usage, etc.)
- A simple plugin design that allows users to easily develop their own service checks
- Parallelized service checks
- Ability to define network host hierarchy using “parent” hosts, allowing detection of and distinction between hosts that are down and those that are unreachable
- Contact notifications when service or host problems occur and get resolved (via email, pager, or user-defined method)
- Ability to define event handlers to be run during service or host events for proactive problem resolution
- Automatic log file rotation
- Support for implementing redundant monitoring hosts
- Optional web interface for viewing current network status, notification and problem history, log file, etc.
Project’s homepage: http://www.nagios.org/
2. Cacti

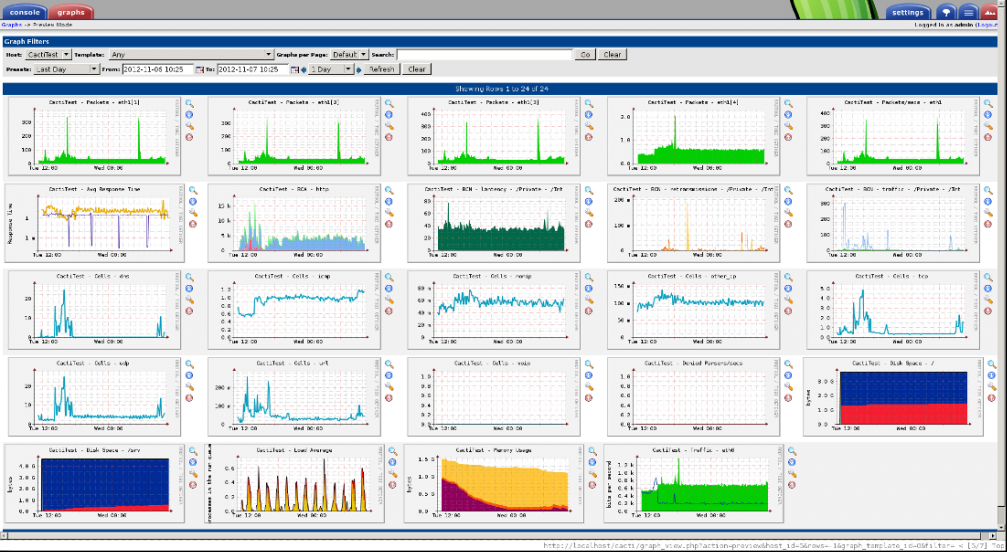
Cacti is another monitoring system licensed also under GPL but unlike Nagios, Cacti is a network graphing solution designed to exploit the power of RRDTool in storing data and building graphs.
It enables users to view CPU load graphs, RAM usage and other information collected from different hosts. Like Nagios, Cacti supports SNMP that makes it possible to monitor: Linux’s, BSD’s and windows hosts.
The primary features of Cacti include:
- unlimited graph items
- auto-padding support for graphs
- graph data manipulation
- flexible data sources
- data gathering on a non-standard timespan
- custom data-gathering scripts
- built-in SNMP support
- graph templates
- data source templates
- host templates
- tree, list, and preview views of graph data
- user-based management and security
Read How to install Cacti on RHEL/CentOS 7.x and Install Cacti on Ubuntu 14.04/14.10
Project’s homepage:http://www.cacti.net/
[ads]
3. Zabbix

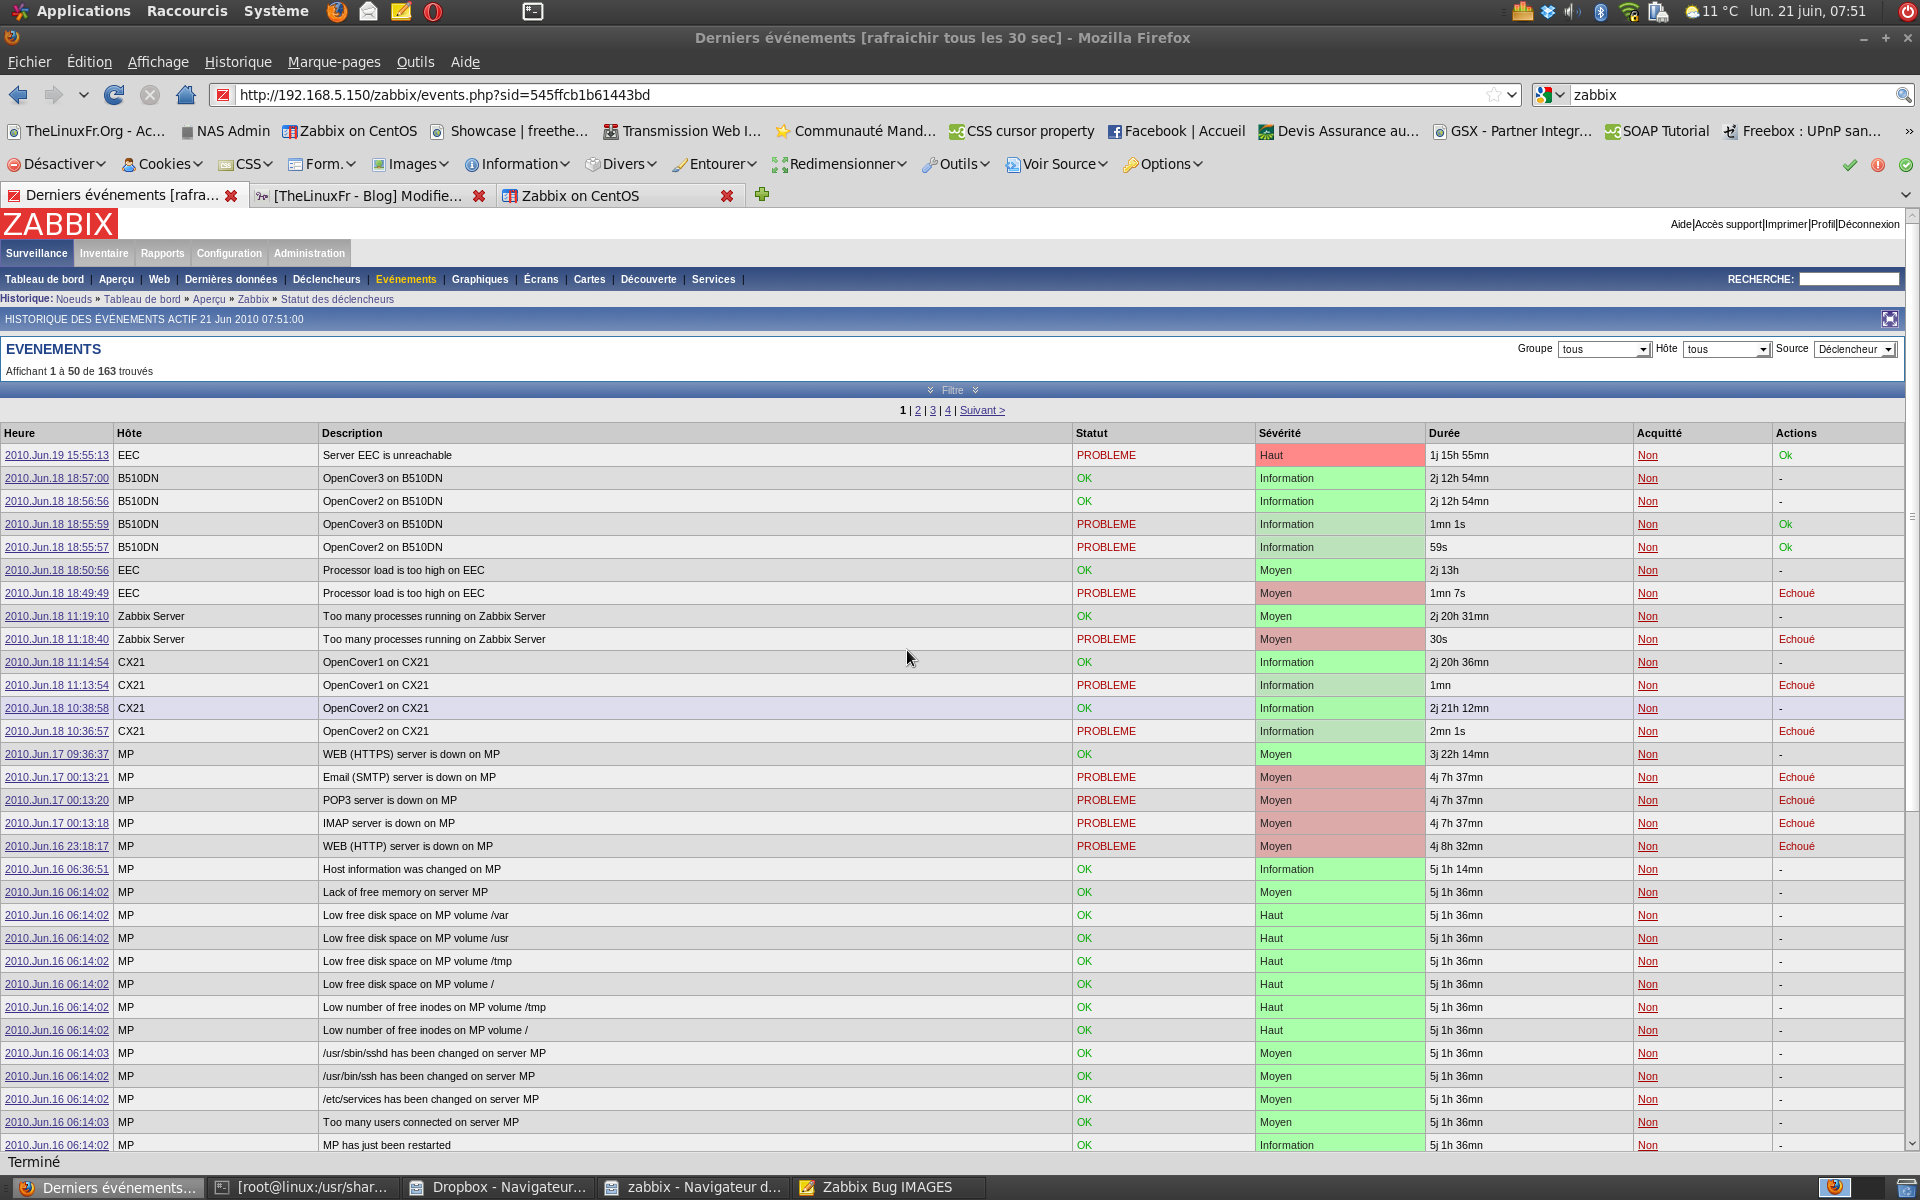
Zabbix is an enterprise open source monitoring solution for networks and applications, created by Alexei Vladishev. It is designed to monitor and track the status of various network services, servers, and other network hardware.
- Zabbix uses MySQL, PostgreSQL, SQLite, Oracle or IBM DB2 to store data.Itsbackend is written in Candthewebfrontend is written in PHP.Zabbix offers several monitoring options:
- Simple checks can verify the availability and responsiveness of standard services such as SMTP or HTTP without installing any software on the monitored host.
- A Zabbix agent can also be installed on UNIX and Windows hosts to monitor statistics such as CPU load, network utilization, disk space, etc.
- As an alternative to installing an agent on hosts, Zabbix includes support for monitoring via SNMP, TCP and ICMP checks, as well as over IPMI, JMX, SSH, telnet and using custom parameters. Zabbix supports a variety of real-time notification mechanisms, including XMPP.
Features of Zabbix include:
- High performance, high capacity (able to monitor hundreds of thousands of devices)
- Auto-discovery of servers and network devices
- Low-level discovery
- Distributed monitoring with centralized web administration
- Support for both polling and trapping mechanisms
- Native high performance agents (client software for Linux, Solaris, HP-UX, AIX, FreeBSD, OpenBSD, OS X, Tru64/OSF1, Windows 2000, Windows Server 2003, Windows XP, Windows Vista, Windows Server 2008, Windows 7)
- Agent-less monitoring
- JMX monitoring
- Web monitoring
- Secure user authentication
- Flexible user permissions
- Web-based interface
- SLA, and ITIL KPI metrics on reporting
- Flexible e-mail notification on predefined events
- High-level (business) view of monitored resources through user-defined visual console screens and dashboards
- Audit log
4. Centreon

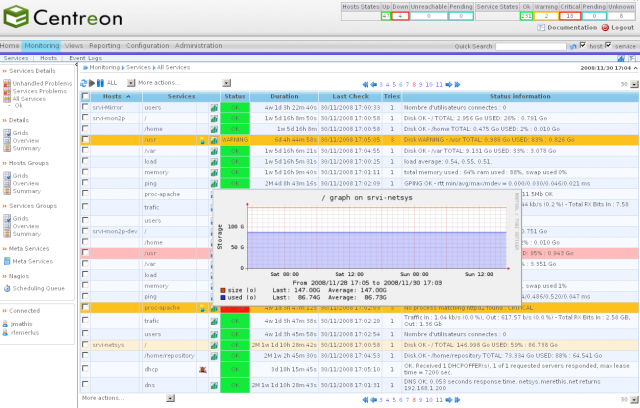
Centreon is open source software which enables you to supervise all the elements comprising your information system.
Centreon has many advantages, we can list the following:
- Enable to monitor the user’s servers, active elements and applications.
- Real-time operating and component management console.
- Ability to maintain and support the whole platform using the publisher solution.
- Unlimited number of uses and extensions via open software mechanisms.
Currently there are 4 different solutions available to suit different organizations with evolving business needs.
- The CES Standard is the only open and unlimited trial version. Unless it has a free access, a powerful industry-standard monitoring solution is offered.
- CES Essentials is CES Standards including access to new software products and services such as Platinum level supports and various software extensions which allow users to automate the daily tasks of administration and monitoring.
- CES Advanced is CES Essentials adding also the Centreon’s complementary plugin pack and different templates comprising databases, applications and infrastructure services.
- The last one is CES Complete which is the mix of all the centreon software products and modules, including BI, BAM and Map. It is also delivered with Platinum level support.
You missed Check_MK and its Open Monitoring Distribution: http://omdistro.org
Not included NetXMS opensource monitoring system. http://www.netxms.org/details/
I have recently come across Glances, which seems good for individual system monitering. I have not tried it yet though.
You missed op5 Monitor as well. http://www.op5.com/download-op5-monitor/, free version givs you 20 hosts to monitor with unlimited services.
you left out one of the oldest and easiest xymon https://www.xymon.com/. It started life as an add on to Big Brother (no longer free and owned by Dell by way of acquisition of Quest Software)
and zenoss http://www.zenoss.org/
i don’t see munin. http://munin-monitoring.org/
You also left out ‘gkrellm’ which displays its hardware monitors in panels and can monitor across a network.
https://en.wikipedia.org/wiki/GKrellM
I think RHQ also worth a look. http://rhq-project.github.io/rhq/#home
Icinga is worth mentioning, as it’s sort of the successor of nagios.
Comon! This is old view of Nagios!
Shinken – http://www.shinken-monitoring.org/ –
Nagios in Python world but with very interesting gui
Librenms , being using to manage automatic backup of network devices, cisco etc. Very simple to setup.
You spelled Icinga wrong. It’s not “Incinga”, as your screenshot and link to the homepage show.
What about Sensu ? To me is the one of the best solutions for the DevOps